Showing posts with label New England. Show all posts

Sunday, February 1, 2015

The December Power Crisis

At 4 PM on December 4th, 2014, the Independent System Operator of New England issued an abnormal conditions alert. Shortly thereafter, wholesale electricity prices jumped from $50 to over $2500 per MWh[1].

Specifically, they issued a Master/Local Control Center Procedure No. 2, which asks all generators and loads to immediately cease testing and maintenance and be ready to generate power, so as to “not further jeopardize the reliability of the power system”[2]. It was New England's cry for help.


The odd thing is that December 4th was a relatively unremarkable day. At 40 degrees Fahrenheit, with no precipitation and little wind, there’s no immediately clear reason for New England’s sudden distress. The New York Independent System Operator saw similar price jumps- sliding suddenly from $36 to $-160 dollars per MWh, and then climbing to over $1000 in a matter of minutes[3]. Ontario’s zonal prices both exploded and crashed, indicating large-scale transmission issues[4]. Whatever was eating at New England’s grid was affecting its neighbors, too. Something was clearly awry in the Northeast, and system operators were acting quickly to compensate.


  Chart above: Wholesale electricity prices in New England's Henry Hub and New York's North zone[1][3].Ontario realtime prices are were not available in data archives.


First, a little background: New England, New York, and Ontario all have structures in place called Independent System Operators, or ISOs (sometimes called RTOs). These are non-profit organizations dedicated to an open electricity market with a strict emphasis on reliability. They do not generate, buy, or sell electricity, but they are in charge of transmission, and their primary goal is to ensure that energy gets where it needs to in a fair and reasonable way. Think similarly to Wall Street for electricity- in the same way that Wall Street needs to ensure that the money from every trade is processed safely and effectively, ISOs ensure that electricity is bought sold, and delivered with no interruptions. Simply put, ISOs are there to ensure that the lights stay on.

There are several ISOs across North America. As open market systems, they provide a reliable structure into which power generators bid in. It's a supply and demand world out there, and as additional generation is needed, ISOs raise the price of electricity, and generators who bid into the market the day ahead are required to come online. A price spike, such as the one seen on December 4th, is indicative of a severe electric supply shortage.


Map of North American ISOs. Note- as of October 2013, the New Brunswick System Operator (NBSO) has been disbanded.

ISOs also have a dedication to releasing some amount of public data, a requirement that independent utilities are not subject to. This means that for New England (ISO-NE), New York (NYISO), and Ontario (IESO), pricing and market data is easy to come by. So how do we find out what happened? The data we're getting from the regional ISOs shows their distress, but not the source of it. In the age of information technology, however, one source of breaking news stands out among the rest: Twitter.
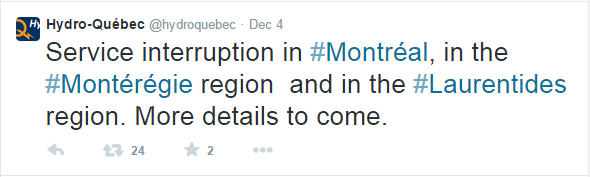


Hydro Quebec is not an independent system operator, but instead a private utility company that controls generation and distribution of electricity throughout Quebec. Quebec is the Canadian province just above New England, and is a region prolific for it’s hydroelectricity which it exports almost continuously. They do not release public data on their markets.

The tweets are short, but there’s a few notable points. Firstly, the scale- 125,000 customers affected. The phrase customers is used by a utility to indicate a specific buyer of electricity- which means that a customer can be anything from a single family household to an office building. Think of power being cut to 125,000 buildings, and you understand the scale of this outage.

Secondly, the outage relates to two lines on the transmission grid. This doesn't mean that a tree fell on a local power line somewhere- the electricity lines you see along the street and outside your house aren't part of the transmission grid, they’re part of the distribution network. The transmission grid is the set of massive high-voltage lines that connect whole power plants to whole cities and towns- lines like these:


Typical transmission lines

Having an outage on a transmission line is bad- really bad. We have talked earlier about how maintaining frequency on the grid is important, and transmission lines help regulate frequency in a big way. Once a transmission line goes down unexpectedly, it can disconnect your generation from your load- which means you have a frequency problem on both sides of the downed line. Not only does this cut power to whatever you were powering, but it trips off generation, causing the power plant to shut down in order to protect itself from the resulting power surge.

This can ripple outward, causing a transmission problem that destabilizes additional lines and knocks more and more power plants offline, exacerbating the problem. In 2003, a single high voltage line in Ohio overheated and failed- and caused a cascading fault that knocked out power to 50 million people for two days, in the Northeast Blackout of 2003[5]. This blackout was one of the reasons that many independent system operators were founded with a focus on reliability.


Once Hydro Quebec saw their transmission lines dropping, they started to worry a lot. They needed to maintain the parts of the grid they still had up, so they quickly slashed power exports to all of their surrounding regions. This was a huge problem for the neighboring ISOs, long used to propping up their electricity demand with Quebec’s hydropower.


And so New York, New England, and Ontario turned inward and fired up their most expensive peaker power plants to make up the difference. ISO-New England, which lost a full 1,500 MW of imported power in a matter of minutes, had to increase their price 50-fold in order to activate their emergency peaker power plants.

But Hydro Quebec soon found the problem widening. Less than an hour later, they had already dropped more customers offline:


This was no longer a problem just for Quebec. With the blackout spreading, the surrounding regions knew that they needed to prevent the issues from escalating. So, all three regions turned the power around and sent their scarce energy back towards Quebec to stabilize the situation:


Chart Above: Average hourly electricity imports and exports from Hydro Quebec. A positive value denotes electricity exports from Quebec, negative value denotes electricity imports to Quebec.[1][3][4]

In two hours, the flow of electricity flipped nearly 5 Gigawatts- almost 25% of New England's typical peak load. For nearly 28 hours, all three ISOs delivered power to Hydro Quebec as it made a slow recovery. Quebec rerouted power, regained control of shut down equipment, and slowly restored power to Montreal and the other affected areas. By 10 PM on December 5th, Quebec had returned to a normal state.


This is a unique example of regional co-operation bringing the power grid back from the brink. This near-failure is both an example of how the grid is intended to deal with unexpected catastrophes, as well as how vulnerable it can be. Quebec didn't see this issue coming, and a month later said that the cause was still unclear[6]. But the regional response was effective and successfully limited the issue in a manner which grid operators were unable to do in 2003. In the end, this crisis hardly made the news- but just barely. If system operators had slipped up even slightly- this could have been a different story.

And for now, the grid goes on as usual, having fully recovered in a matter of days. Undoubtedly, more unexpected problems like this will arise, and we can only hope that grid operators are able to respond as quickly and effectively as they were on December 4th.


Sources:


[1] ISO-New England. Preliminary Five-Minute Real-Time LMPs. 01/28/2015.


[2] ISO-New England. Master and Local Control Center Procedures. 01/31/2015.


[3] NYISO. Pricing Data. 01/30/2015.


[4] Independent Electricity System Operator. Data Directory. 01/30/2015.


[5] Scientific American. The 2003 Northeast Blackout- Five Years Later. 08/13/2008.


[6] Concord Monitor. Widespread Hydro Quebec Outage Fuels Concern Over Future Reliability in N.H.. 12/27/2014.

Monday, December 8, 2014

Baseloads, Peaks and Capacity Factors

High Voltage Power Lines


Balancing the power grid is a tough problem, made even tougher by the fact that power plants can't always be relied on. Many plants only run in certain conditions- solar during the day, wind when it is windy- and all plants have downtime for maintenance or refueling.

For a electric grid operator, this presents a problem. Power grids are closed electrical systems, and as such, need to remain balanced between generation and load. In the US, all electrical equipment is built to run at a grid frequency of 60 Hz- have too many or too few plants generating power, and you'll deviate from that special frequency and start damaging equipment all over the grid. Once the equipment fails or trips offline due to frequency variation, you could see a cascade into widespread blackouts like in 2003[1]. 

Not only that, but grids currently have very little ability to store energy in any way- meaning that the power coming from all of these power plants must be carefully balanced at all times to keep the grid stable. Grid operators call power plants into action as load increases, and turn them off when load decreases, maintaining the balance of power throughout the day. In order to do this, operators need a good understanding of the capacity available to them.

Capacity is the maximum normal power output of a generator. If you recall from our discussion of power and energy units, power is the instantaneous output of energy- it's exactly what grid operators are balancing.

Grid operators have to plan their capacity deployments carefully. Energy can't be stored, and operators have to hit a moving target as electricity demand fluctuates through the day. This means that they need to ensure they have enough capacity available for peak demand, when grids have their highest power requirements. Let's take as an example the total load in New England on an August weekday:


Above: The electrical demand of New England on August 20th, 2014. Data from ISO-New England[2].


A power plant's capacity factor is a measure of how often they are generating power at or near their rated capacity. It can be thought of as their average output compared to their maximum:

Capacity Factor

In other words, the capacity factor is how often a power plant is running. For plants that run on a fuel, this is often influenced by fuel costs. Cheaper plants will typically be called to run more often, resulting in higher capacity factors.

When trying to meet demand, grid operators must use different power plants for different purposes. Baseload plants stay on almost around the clock to meet demand that never sleeps, and are typically the cheapest to run per unit of energy. They often won't- or can't- shut down easily, meaning that 24 hour operation is a necessity rather than a business choice. Load-following power plants generate power to cover the daily ramp up of usage during the day, and have the ability to come online quickly to meet daily increase in demand. A few others are peaking power plants, designed to operate only a few times a year at times of extreme peak demand. These are typically the most expensive to run, and often they are some of the last resources for a grid to call before running out of power.

How do you know which is which? Well, we can tell easily by looking at the capacity factors- baseload plants running most often with the highest capacity factors, and peakers running least.


Above: Average capacity factors of fuel-based power plants in the US, 2013. Data from the EIA[3].


But the above data doesn't take into account intermittent renewables. We should make the distinction between dispatchable and non-dispatchable generation- renewable sources often run without being dispatched, only when conditions are right. Due to advanced weather forecasting, operators are more than ever able to predict and plan for wind and solar output, so they typically generate in the same role as a baseload power plant- contributing as much as they can whenever they can, at low cost. Solar power also often generates at times very close to the actual peak demand, which helps to offset the need for more expensive load-following and peaker power plants.


Above: Average capacity factors of non fuel-based power plants in the US, 2013. Data from the EIA[3].


We can see that primary among the baseload plants is nuclear power, with a whopping 90% capacity factor. High energy fuel and rare shutdowns make it easy for nuclear plants to run around the clock, and shutdowns can be difficult and expensive. Biomass plants are able to run often as well due to low fuel costs- typically municipal trash or other waste streams which are easy to procure. Geothermal and hydroelectric generators provide reasonably stable support, and wind and solar round out the rest when they can, though with lower capacity factors. Often large, more efficient natural gas and coal plants make up any remaining baseload needs. 

Load-following power plants are most often coal and natural gas, although gas has the ability to respond more quickly. These plants jockey for lower fuel costs, and the recent shale gas boom has given the economic edge to natural gas. Even so, in most southern and midwestern states, coal still serves a significant baseload and load-following role, despite the gas dominated northeast closing many coal plants in favor of further cheap gas development.

Peaker power plants typically involve smaller petroleum and gas plants that are able to fire up quickly and run only a few days a year. Because of their limited operating hours, these plants are typically old, expensive, and inefficient, but get paid handsomely for their performance. Petroleum based plants rarely serve a role outside of peak hours, which is why they earn the lowest average fuel-based capacity factor at 22%. 

So, in order to meet The total load of a grid, we end up with a power profile that looks like this:


Above: Approximate Generator roles for New England, Aug 20th 2014


This isn't exact, but it's a good idea of how grid operators need to think about their assets. A baseload power plant can't usually perform the same role as a peaker or load-following plant, as it can't switch on and off quickly. Conversely, a peaker power plant can't handle running 24-7 and would likely fail. This stack is one of the reasons that maintenance on larger power plants must be carefully accounted for- operators need to have enough of a diversity of power plants to fill each needed role and meet total demand.

At least the grid operators know what they have to work with. If you're curious for more insight, many system operators offer access to their real-time system data- check out ISO-NE's real time energy dashboard[4]. and phone app[5]. Both of these applications give you good insight into what's really happening when you flip your light switch on in the afternoon. That energy doesn't come out of thin air- but where exactly it comes from certainly depends on many factors.


Sources:

[1] NY Daily News: Northeast Blackout of 2003. 08/14/2013

[2] ISO-New England: Energy, Load and Demand Reports. 08/20/2014

[3] Energy Information Agency: Electric Power Monthly. 09/25/2014

[4] ISO-New England: Real Time Maps & Charts. 12/04/2014

[5] ISO-New England: ISO to Go. 12/04/2014

Monday, September 30, 2013

Trading in Nuclear for Something New: Implications of the Vermont Yankee Shutdown

Entergy announced on August 27th that it would close it’s Vermont Yankee nuclear power plant, located in Vernon, Vermont, in late 2014. Following a small number of other troubled nuclear plants, Entergy cited the low cost of natural gas and “artificially low electricity markets” as the reason for the closure. The state government and many Vermont citizens are happy to see it go- but as the largest energy generator in the state, how will it change the energy landscape of Vermont and the rest of New England?
The Vermont Yankee nuclear power plant


The (Brief) History of a Yankee

Vermont Yankee came online in 1972, directly in the midst of the US nuclear era. A 650 MW plant, it was originally licensed for a 40 year schedule of operation by the Nuclear Regulatory Commission (NRC). It’s a pretty standard light water reactor, similar to most of the nuclear reactors built in the 60s and 70s that are still operating today.


But today, it’s impending closure draws celebration from many Vermonters, including Governor Peter Shumlin. In 2010, the Vermont Senate voted 26 to 4 to block the recertification of the plant by the Vermont Public Service Board, which oversees Vermont's utility industries. So what turned Vermont’s citizens against the plant?


Nuclear power in the US has drawn criticism and distrust countrywide from the very start, due to its association with the 1940s development of nuclear weapons. Economic problems for the nuclear industry in the late 1970s seemed to break the illusion that nuclear power was to outright replace fossil fuels, and issues were joined with a renewal of public fear in 1979 over the Three Mile Island nuclear accident in Harrisburg, Pennsylvania. One of the nuclear reactors there suffered a partial nuclear meltdown, destroying the reactor and requiring an expensive decommissioning. Finally, in 1986, the Chernobyl disaster in Ukraine struck a near fatal blow to the public perception of nuclear power, standing as the worst nuclear disaster in history. Chernobyl brought a new fear to the public mind- radiation.

The destroyed Chernobyl reactor in 1986. The disaster
killed dozens and left a large amount of Eastern Europe
contaminated with radiation.


Vermont Yankee carried on through this much like other US nuclear reactors- generating a steady part of US baseload energy cheaply and cleanly, while generating nuclear waste which the US still can’t decide what to do with (Link, Yucca Mountain). In 2002, Entergy bought the plant for $160 million.


Vermonters tend to have their own personal style of opposition, including the occasional 12 foot long antinuclear paper-mache cow. The steady group of Vermont nuclear protesters were galvanized in 2007 when a cooling tower at the plant partially collapsed, causing the plant to have to reduce it’s power output while repairs were completed. Then, in early 2010, Vermont Yankee reported detecting radioactive tritium in local groundwater monitoring wells. The leak was traced to a corroded steam pipe and repaired without noticeable contamination of drinking water supplies, but the cleanup was incredibly expensive for Entergy.


Yankee’s safety was the primary driver in the Vermont Senate’s attempt to prevent its relicensing. Despite the state's efforts, the Nuclear Regulatory Commission was behind Vermont Yankee, offering a 20- year license extension in 2012. Entergy and the State of Vermont became locked in a long legal battle, which ended in a victory for Vermont Yankee in 2013, in which the federal government ruled the State did not have the authority to force the plant to close. Less than a month after winning their battle to keep Yankee open, Entergy announced their decision to voluntarily close the plant in 2014.


Despite their odd timing, Entergy is claiming that the plant is simply not economically sound to run given the plummeting cost of natural gas created by the new hydraulic fracturing rush. It’s unlikely that this alone would cause the plant to be too costly- after all, there are over a hundred other similar nuclear plants with no imminent plans to close- but it is entirely possible Vermont Yankee has more needed upcoming maintenance and repairs, and Entergy does not want to take their chances footing a large bill to keep the old plant running.


As to giving up just after winning the lawsuit, this might be chalked up to a moral victory- Vermont Yankee isn't Entergy’s only nuclear electric power plant, and giving up to avoid a costly legal battle would set the precedent that other states can push their nuclear plants towards closure as well. Entergy is seeking to make a point: the Nuclear Regulatory Commission, the federal governing body built to oversee and manage the US portfolio of nuclear reactors, is supreme. This is especially important as talk of new development in the nuclear industry is slowly bubbling up- Entergy doesn't want to run the risk of having further projects shut down despite their federal backing.


The End of Vermont Nuclear


The Energy Information Agency actually has data on every power station in the US- which is actually pretty great. From this you can piece together a pretty good picture of Vermont’s energy generation portfolio. Vermont has one of the cleanest generation schemes in the US- with several hydroelectric plants, some new solar and wind, and rare scattered fossil-fuel generators, the state only has a single plant that utilizes natural gas. Vermont and Rhode Island are the only two states to not have a single coal-fired power plant.

Vermont Yankee is the state’s only nuclear power plant, and yet you may be surprised to learn that it consists of nearly 3/4 of the state’s annual generation.


This has to do with the economics of scale; the dozen plus large hydroelectric projects in the state are on rivers that simply are not big enough to be huge generators. Nuclear power utilizes a smaller footprint to generate more electricity, something most renewable technologies don’t have the opportunity to do.


If you’re worried that Vermont as a state could never make up for a loss of almost three quarters of its electrical generation and that the state will go dark, you need not be. Green Mountain Power, the state’s largest transmission company, stopped purchasing power from Vermont Yankee in 2011. To be honest, one of the reasons energy generation is rarely reported by state is that it is rarely used in the same state it was produced- the US electrical grids are widely interconnected, and market sales of electricity cross borders more often than not. Although Green Mountain Power makes a point of siding with the people of Vermont by refusing a contract with Vermont Yankee, they do not state quite as directly that much of their generation comes instead from nuclear power in Massachusetts and Connecticut.


But when it comes down to it, Vermont is already an energy importer- whether it be hydroelectric power from Canada or nuclear from New England. But this still means that more economic activity is moving out of the state- which is a tough blow for a state that has struggled to keep jobs inside it's borders and has seen large drops in population. And if the energy Vermont Yankee is producing isn't used in Vermont, then the implications for New England might be more interesting.


The Evolving Energy Landscape of New England


In 2011, Vermont Yankee generated nearly 4% of the electricity generated in New England. That may not seem like a whole lot, but it will be missed- and needs to be replaced.


New England is a special place, in terms of energy. It has a very clean generation profile compared to the US as a whole, and it‘s been getting cleaner. When you take the whole region’s power supply breakdown, it looks like this:


Coal, the king of electricity in the US, is dwarfed by other technologies in the New England states which boast a staggering 50% generation through natural gas. Although cleaner than coal, natural gas still produces a lot of carbon dioxide- so while it’s environmentally better, it’s not the best. But when it comes to New England, 43% of their generation is greenhouse gas free (almost- see this), which is impressive. The bulk of that greenhouse gas free generation is though nuclear plants like Yankee.


So what will replace Yankee? Well, lets look at how New England has changed in the last twenty years:


It certainly won’t be a coal or petroleum plant, but you all already knew that. New England has been aggressively phasing out coal through fuel switching and renewables. In fact, New England has replaced 65% of it’s coal power and 98% of it’s petroleum generation to cleaner alternatives from 1991 to 2011, so it’s pretty safe to say that that’s not happening.

It’s also unlikely to come from hydroelectric power or more nuclear- hydro because nearly all of the hydroelectric sites that can be developed have been, and nuclear because there isn’t enough public support in the air yet- especially not in a victorious Vermont.

So what does that leave us? A few options stand out: solar, wind, and natural gas. Let’s take a look at each.


Replacing Vermont Yankee with Solar


A 2.2 MW solar farm recently installed in South Burlington, Vermont

When it comes to solar panels, central generation isn’t its strong suit. Solar technology has exploded on the New England grid from 0 MWh in 2007 to 6,579 MWh in 2011- but, that still is only 0.0053% of the grid’s power. That’s next to nothing.

But solar does shine in distributed generation- which is a lot harder to measure quantitatively. When you put a solar panel on your house, you buy less energy from the grid- so the grid needs to generate less energy. From the utility’s point of view, it looks identical to you having a newly efficient home. Solar is almost certainly a contributor to the decrease in energy demand across the US recently, but how much so is uncertain.

For now, though, we're considering replacing Yankee with grid power. The National Renewable Energy Laboratories (NREL) has a map of solar potential across the US- how much energy a standard solar panel could pick up on an annual basis. Looking at southern Vermont, where Vermont Yankee is now, we see that you could generate between 4.0 and 4.5 kWh per square meter of solar panel per day, on average. But we're not very good at capturing this energy- we can hardly extract 0.58 kWh per day out of this, on average. We need to generate 4,907,355,000 kWh a year. Each of our square meter solar panels would produce...


And to cover Vermont Yankee, that means we need:

23 Million solar panels covering 5,680 acres

That is a lot- and it would probably take up a bit more space because Vermont is far enough North that the panels would need to be tilted to pick up enough sun. Solar has been growing quickly, but it's unlikely that it will be able to expand quite that fast to cover the space that Yankee will leave behind.


Replacing Vermont Yankee with Wind

A wind turbine from the 40 MW, 16 turbine Sheffield Wind Farm

Wind will probably be a little more effective than solar power here. Wind is more often considered a viable part of grid-scale generation, and actually covers 0.7% of New England’s total generation. When it comes to where this wind is being generated, however, you may notice something interesting:

Maine seems to have a monopoly over wind generation, covering over 80%. That’s no coincidence- Maine has the largest amount of unpopulated wilderness, and that’s its biggest play. When it comes to wind power, people are wind’s worst enemy- shooting down projects because they would be loud, ugly, or require environmentally damaging mountaintop construction. This is often called NIMBY- the Not In My BackYard effect- and has been most famously encountered in the Cape Wind project in Massachusetts.

But lets take a look- how many wind turbines are we talking?

GE manufactures a modern wind turbine with a maximum power output of 2.5 MW, which is one of the largest on the market. This means that when enough wind is blowing, it will generate that much power. The wind doesn't blow all of the time though, so they won't generate that much power all of the time. However, the northeast is a pretty good place for wind- so we can assume that each of our turbines will have a decent output, around a capacity factor of 0.25- meaning that they're operating near full power an average of 25% of the time.

And that means:


At that rate, we'll need:

900 Wind turbines

So we’re looking at nearly 900 new wind turbines in the Northeast to match Yankee’s annual output. This is a 564% increase in the Northeast’s wind power, though- which means it would not be an easy feat. Finding locations, beating local resistance, and being able to install all of these would be remarkable. A good start would be to complete the Cape Wind project- which would result in the installation of 130 wind turbines of the coast of Massachusetts. Replacing Vermont Yankee with wind would be difficult, but it could be done.

The only problem with both wind and solar is that it fills a very different role in the electrical grid than nuclear power. Both wind and solar are intermittent sources of power, meaning that they cannot be relied on during any specific period- much of the time they won't be generating anything. Nuclear, on the other hand, is usually a baseload power source- meaning that it is always running, providing the power that is used first in the grid, and can be turned on and off when needed. Switching this baseload to renewables would stress the readiness of the grid- but wouldn't be impossible. 


Replacing Vermont Yankee with Natural Gas

The Fore River Generating Station in North Weymouth, MA
Natural gas has an advantage over wind and solar in that it has been growing at a much larger scale recently. This is mostly because of the new gas fracking boom, which has dropped the price of natural gas.

Between 2001 and 2011, New England’s annual natural gas generation has increased by 30,000,000 MWh, over six times Vermont Yankee’s output. Natural gas units have varied sizes and electrical outputs, but we can use as an example the Fore River Generating Station, a natural gas plant about the same size as Vermont Yankee, in North Weymouth just south of Boston. Given a new, similarly modern plant to Fore River as our replacement for Yankee, we are looking at:

1 Plant, containing 3 generating units

Natural gas generation is a large carbon dioxide emitter, however- and according to the IPCC estimates, a natural gas plant of the size of Vermont Yankee would produce nearly 2.3 million metric tons of carbon dioxide a year. As solar, wind, and Vermont Yankee itself are nearly carbon dioxide free, this represents a sizable slip in New England’s carbon reduction goals. But natural gas has none of the siting issues as the other two- in fact, a closing coal plant could be easily retrofitted into a gas plant.

The other effect of New England’s large conversion to natural gas is that it potentially ties electricity to a fuel that’s had very volatile price rates in the past. Nuclear is one of the most stable electricity sources when it comes to cost- and so, if the natural gas fracking rush suddenly goes to bust, New England could lose out.

Finally, natural gas would never be installed in Vermont- the state has enough resistance to gas development that gas development would assuredly happen in Massachusetts, or Connecticut. This means that Vermont is losing high paying, technical jobs- something the state has been struggling with.

So what’s likely to happen? Unfortunately, it’s probably no contest- natural gas development is a nearly guaranteed replacement for Vermont Yankee. Solar and wind will certainly be growing at high rates, but are unlikely to overtake the generation of Yankee for some time. And this may be a repeated scenario across the US soon, as more domestic nuclear plants shut down due to age restrictions. The US is converting to gas faster than renewables- and is spinning down coal and nuclear. In general, this is resulting in lower greenhouse gas emissions, but results in a dangerous economic time bomb- if natural gas prices go back up, we'll see a much larger impact on energy prices in the US than ever before.

One thing that comes without a doubt is that much of Vermont is celebrating the closing of Vermont Yankee. And this isn't unprecedented- their concerns about Vermont Yankee's safety were valid. But as New England likely quietly turns to natural gas in it's absence, we must remember that sometimes you have to be careful what you wish for.


Sources

http://healthvermont.gov/enviro/rad/yankee/tritium.aspx
http://www.safeandgreencampaign.org/
http://nuclear-news.net/2013/08/15/public-service-board-may-find-vermont-nuclear-plant-not-in-the-public-good/
http://www.boston.com/news/local/vermont/articles/2010/02/24/nrc_confirms_2005_tritium_leak_at_vermont_yankee_plant/
http://psb.vermont.gov/
http://www.nrel.gov/gis/solar.html
http://www.ge-energy.com/wind
http://www.exeloncorp.com/powerplants/foreriver/Pages/profile.aspx